Velocity autocorrelation and its power spectrum
In order to get the power spectrum of velocity autocorrelation from the MD simulation result, firstly we have to think how long the MD simulation has to be run. In case of Si, its phonon DOS exists up to about 20 THz which is the inverse of time interval of sampling data. And the frequency resolution is the inverse of simulation time. So the time interval between successive sampling data should be about 20 fs (which corresponds to 25 THz since the half of data will be omitted because of the symmetry.) And the simulation time should be 10,000 fs which corresponds to the frequency resolution 0.1 THz. Thus, one has to make about 500 atomic configuration (pmd or dump format) files for the power spectrum calculation.
To get the velocity autocorrelation and power specturm, you can use
vel_auto_corr.py in nappy directory.
python /path/to/nap/nappy/vel_auto_corr.py -t 20.0 -m 5 -s 50 pmd_*
-t--- the time interval between successive files.-m 5 -s 50--- the number of staggered shifts and amount of shits of initial time for sampling.
Then you get dat.autocorr and dat.power files.
dat.autocorr includes velocity autocorrelation functions of all the species and sum of them
dat.power also includes power spectrums of all the species and sum of them.
If this power spectrum graph seems too spiky, you can smear it by using
gaussian_smear.py as,
python /path/to/nap/nappy/gaussian_smear.py -x 1 -y 5 -s 2.0 dat.power
Then you get dat.power.smeared file which contains only 2 columns of
blurred data of 1st and 5th columns of dat.power.
The vel_auto_corr.py can also do the Gaussian smoothing by giving a option such as, --sigma 2.
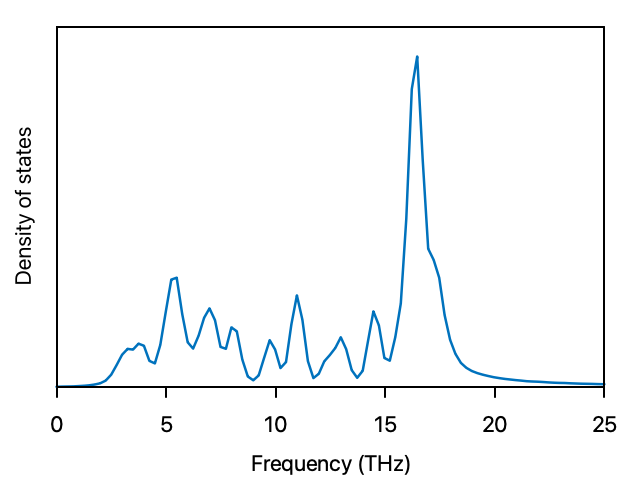
The figure below is an example of power spectrum of diamond Si that is comparable to phonon-DOS computed from the phonon calculation.